Disclaimer: These thoughts are theoretical, idealized and over-simplifications of what is found in practice.
For a mathematical treatment of the origin of the Capstan effect, see Apparent loss of friction - #4 by AikBkj .
Capstan effects - Exponential changes in the magnitude of the tension of a rope that is:
- sliding on/around a curved surface
- attached to some load on one end and
- being hauled, eased or held (see assumptions) at the other end
These tension magnitude changes rely on:
- the sliding coefficient of friction and
- angle of contact (in radians) between the rope and the curved surface
Assumptions include (minimally):
- if the sliding of the rope is halted by the slightly increasing or decreasing of the tension at what becomes the held end of the rope, the tension profile in the rope while steadily sliding is preserved
- the static and sliding coefficients of friction are equal and
- the sliding speed is not a factor
In the diagram below:
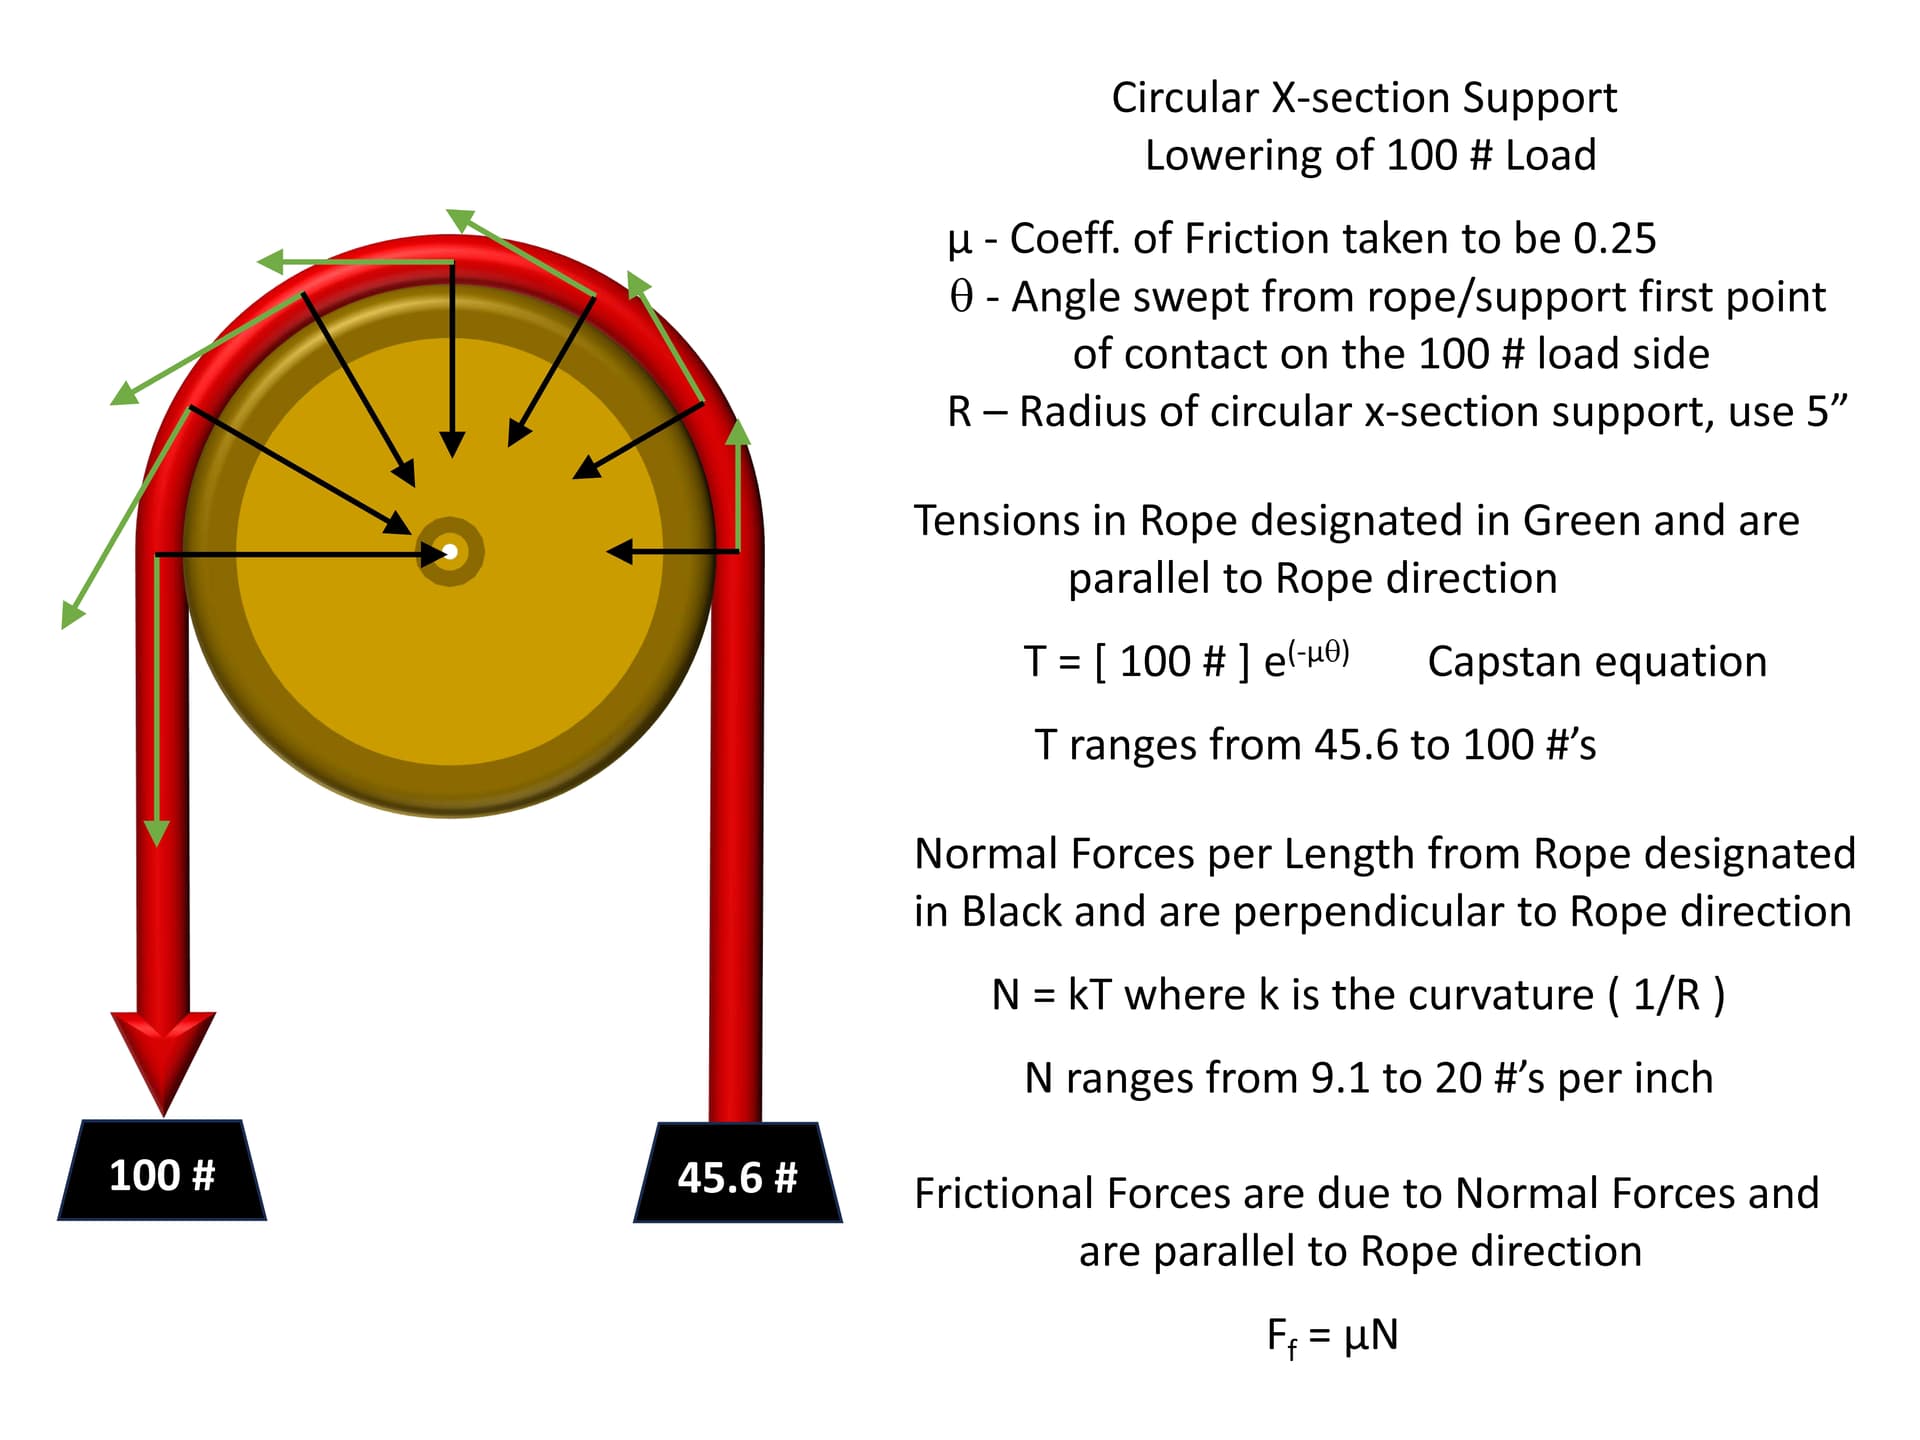
- a 100 pound load is shown being lowered from a horizontal support of circular cross-section (support cross-section shown in brown) by
- maintaining a resisting force of 45.6 pounds at the easing end of the rope (rope shown in red)
- the magnitude and direction of the tension in the rope is shown by a green arrow for a selection of points spaced at 30 degree intervals
A note on tensions and the directions shown, if one were to conceptually cross-section and slightly separate the rope at a particular point to expose two identical faces, one could say that, prior to cross-sectioning, each face was drawing the other face toward itself with a force equal to the tension, T, at that point. That is, each face applies an equal in magnitude but opposite in direction force on its counterpart at every point in the rope. For simplicity and in relation to the motion of the rope, the tensions shown in the diagram are only the forces that the leading face applies to the trailing face for the selected points in the rope.
It is worth noting that the magnitude of the tension in the rope on a curved surface always exponentially increases in the direction of the rope’s motion.
The reason for this:
- the length of trailing rope in contact with the curved surface increases the farther along the curved surface the rope has been in contact
- this increasing length of trailing rope corresponds to an increasing sum of frictional forces (which always opposes the motion)
- overcoming this increasing sum of frictional forces require corresponding increases in the tension
Normal forces of the rope against the curved surface:
- are a consequence of and proportional to the tensions in the rope
- generate the frictional forces which are parallel the direction of the rope’s motion at every point
In the above diagram:
- normal forces of the rope against the curved surface are shown as black arrows
- it takes less force by a factor of approximately 2.2 to ease the rope and lower the load
- the frictional forces and Capstan effect could be considered helpful
This factor of 2.2 is due to the Pi radians of rope/support contact and the 0.25 value for the coefficient of friction that we have chosen for this example, that is, the exponential of (0.25 times Pi) equals 2.2.
In the next diagram:
- a 100 pound load is shown being lifted by applying a hauling force of 219 pounds
- it takes more force by the same factor as before of approximately 2.2 to lift the load
- the frictional forces and Capstan effect could be considered a hindrance
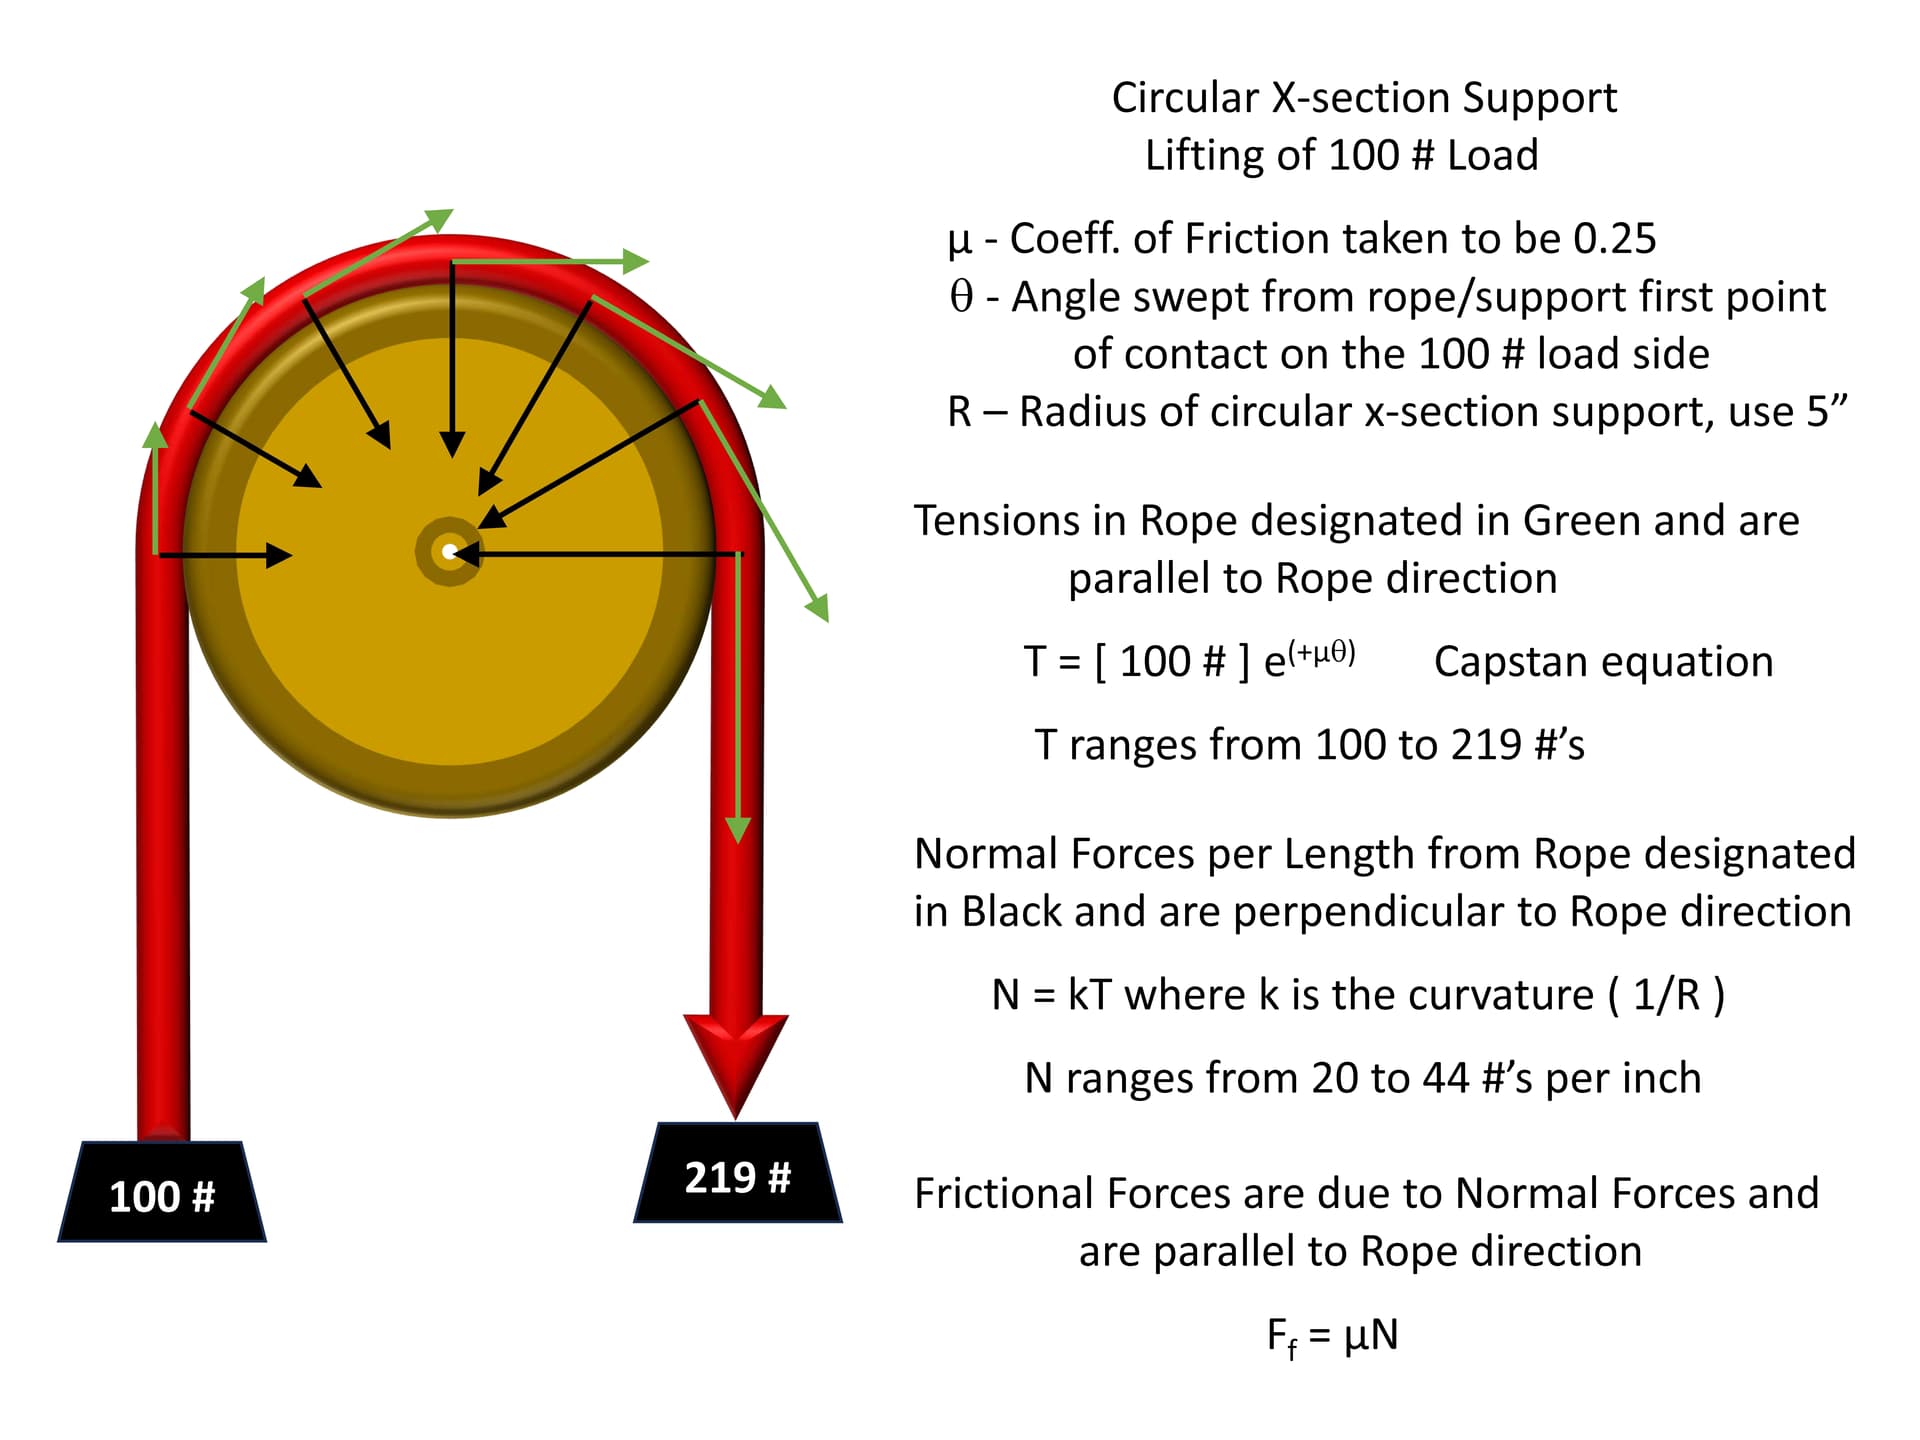
Again we see that the tension in the rope increases exponentially in the direction the rope travels. Of interest is that once the load has been lifted by temporarily applying more than 219 pounds of force to the hauling end of the rope that this suspended load will hang static and not begin to lower until the force applied to the held end of the rope is reduced to 45.6 pounds.
The next graph shows:
- the development of rope tension profiles during the initial lifting of the load as in the previous diagram
- as force is applied at an increased level to the hauling end of the rope, the rope initially slides over the support toward the hauling end and the tension profile increases
The Capstan model predicts the tension in the rope will be:
- constant from the load to the first point of rope/support contact (angle defined as zero degrees)
- exponentially increase from this first point of rope/support contact from the load side to the point where the rope loses contact with the support (at an angle of 180 degrees, Pi radians) and then
- constant to the hauling end of the rope
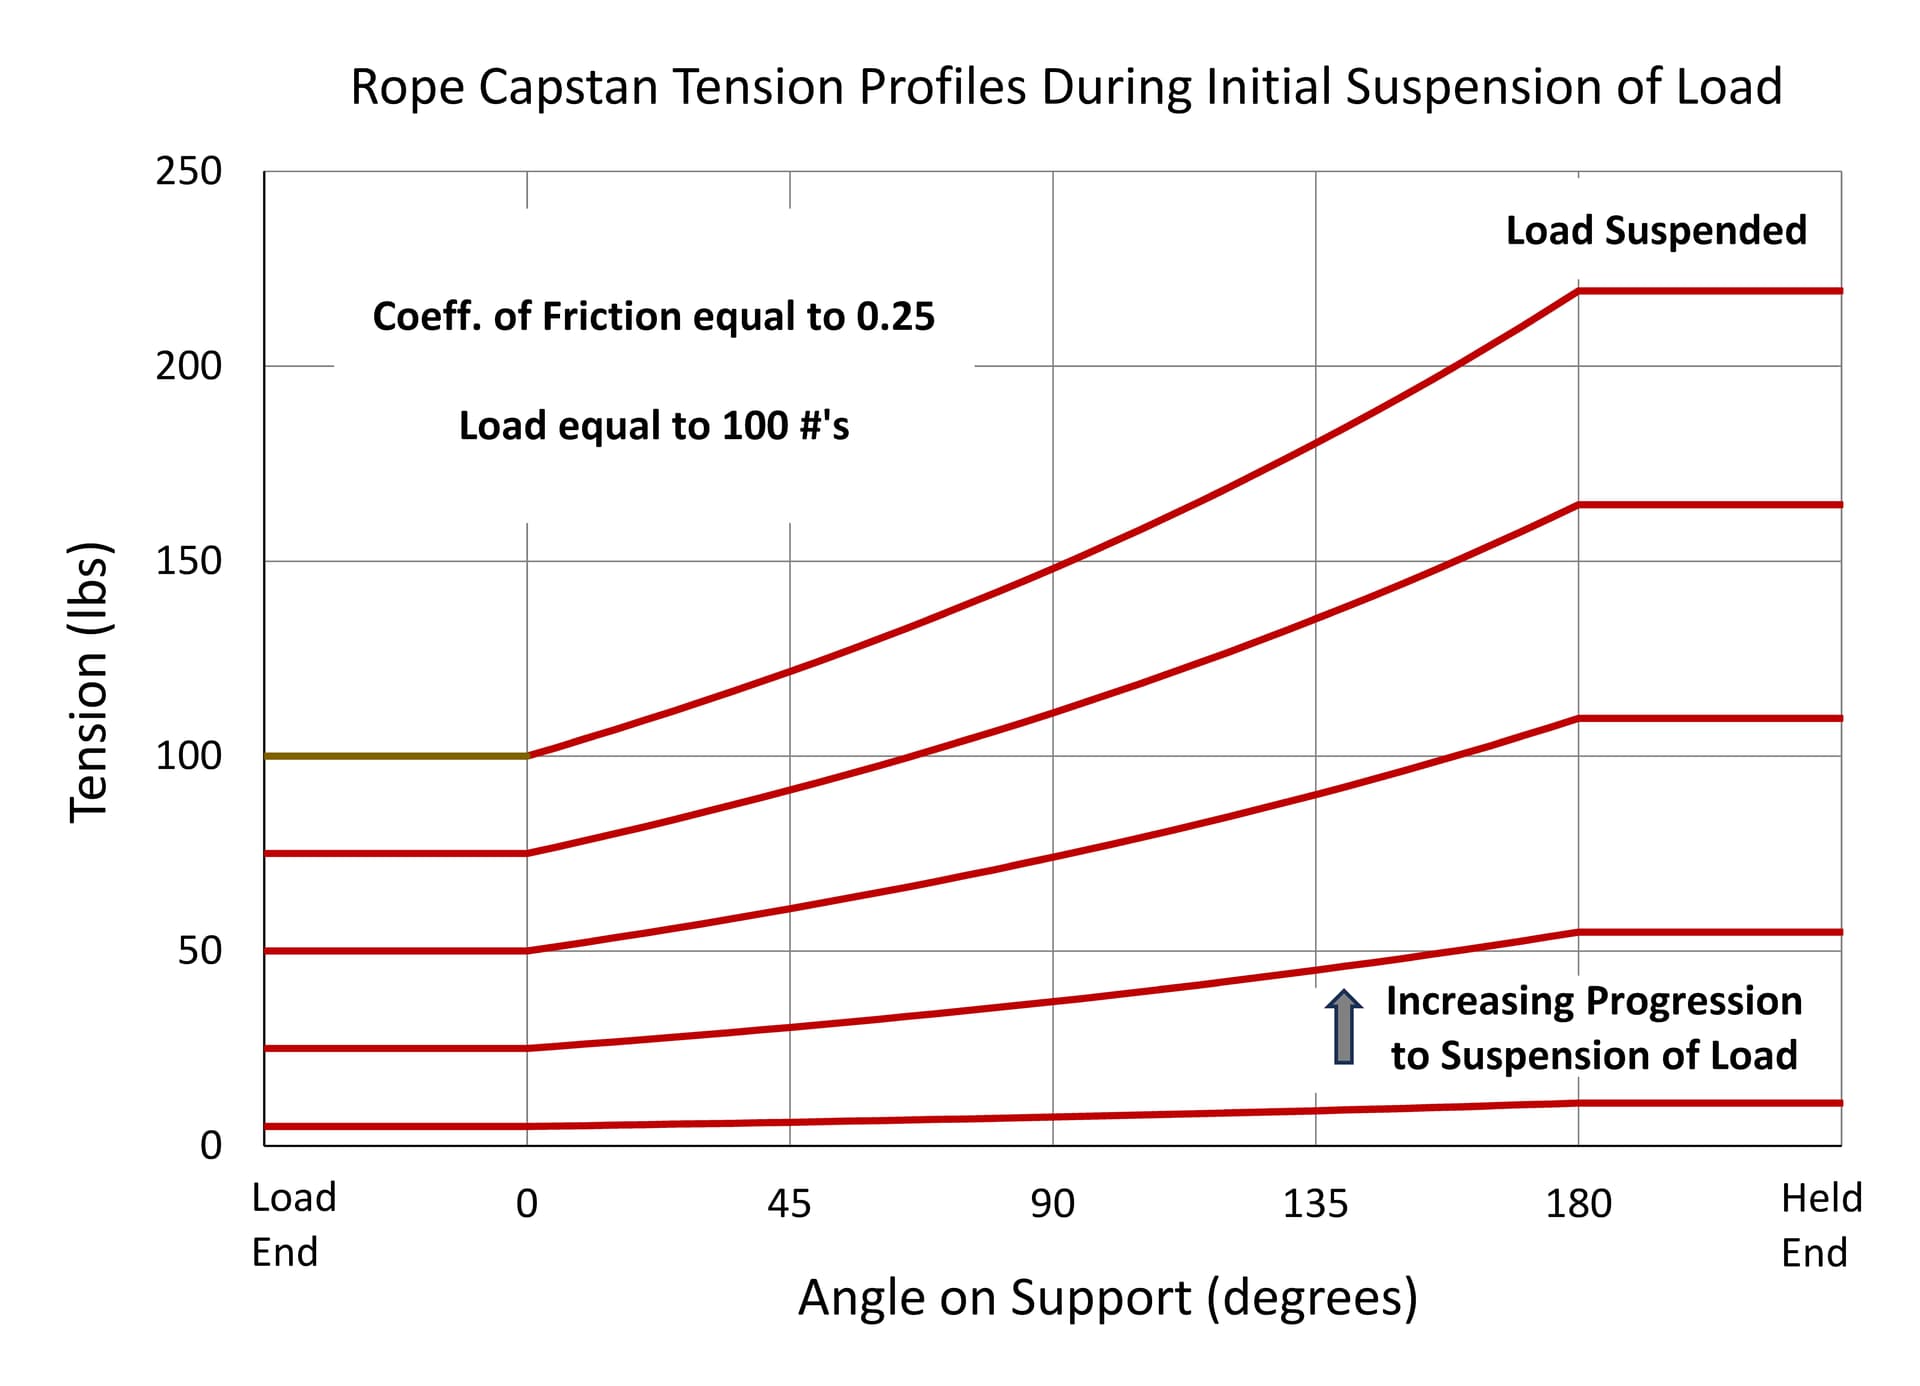
The force applied to the load being lifted is always less than applied at the hauling end due to the additional forces of friction between the rope and support that must be overcome. For each increase in the level of force applied to the hauling end of the rope, the entire rope tension profile increases. At a force of 219 pounds applied at the hauling end, a force of 100 pounds will be applied to and will lift the load. At forces greater than 219 pounds, a force greater than 100 pounds will be applied to the load causing its lifting to accelerate.
In the next graph of easing a lifted static load:
- the upper brown/red tension profile curve represents the steady lifting of the 100 pound load
- the lower brown/green tension profile curve represents the steady lowering of the 100 pound load
- the brown/red/blue curves represent various tension profiles for the static load at intermediate levels of force at the held end
Following the initial lifting one can imagine stopping the lifting and the suspending of the load by decreasing the force to slightly less than 219 pounds at the held end. It is assumed that this preserves the upper steady lifting brown/red tension profile curve for this static suspended load.
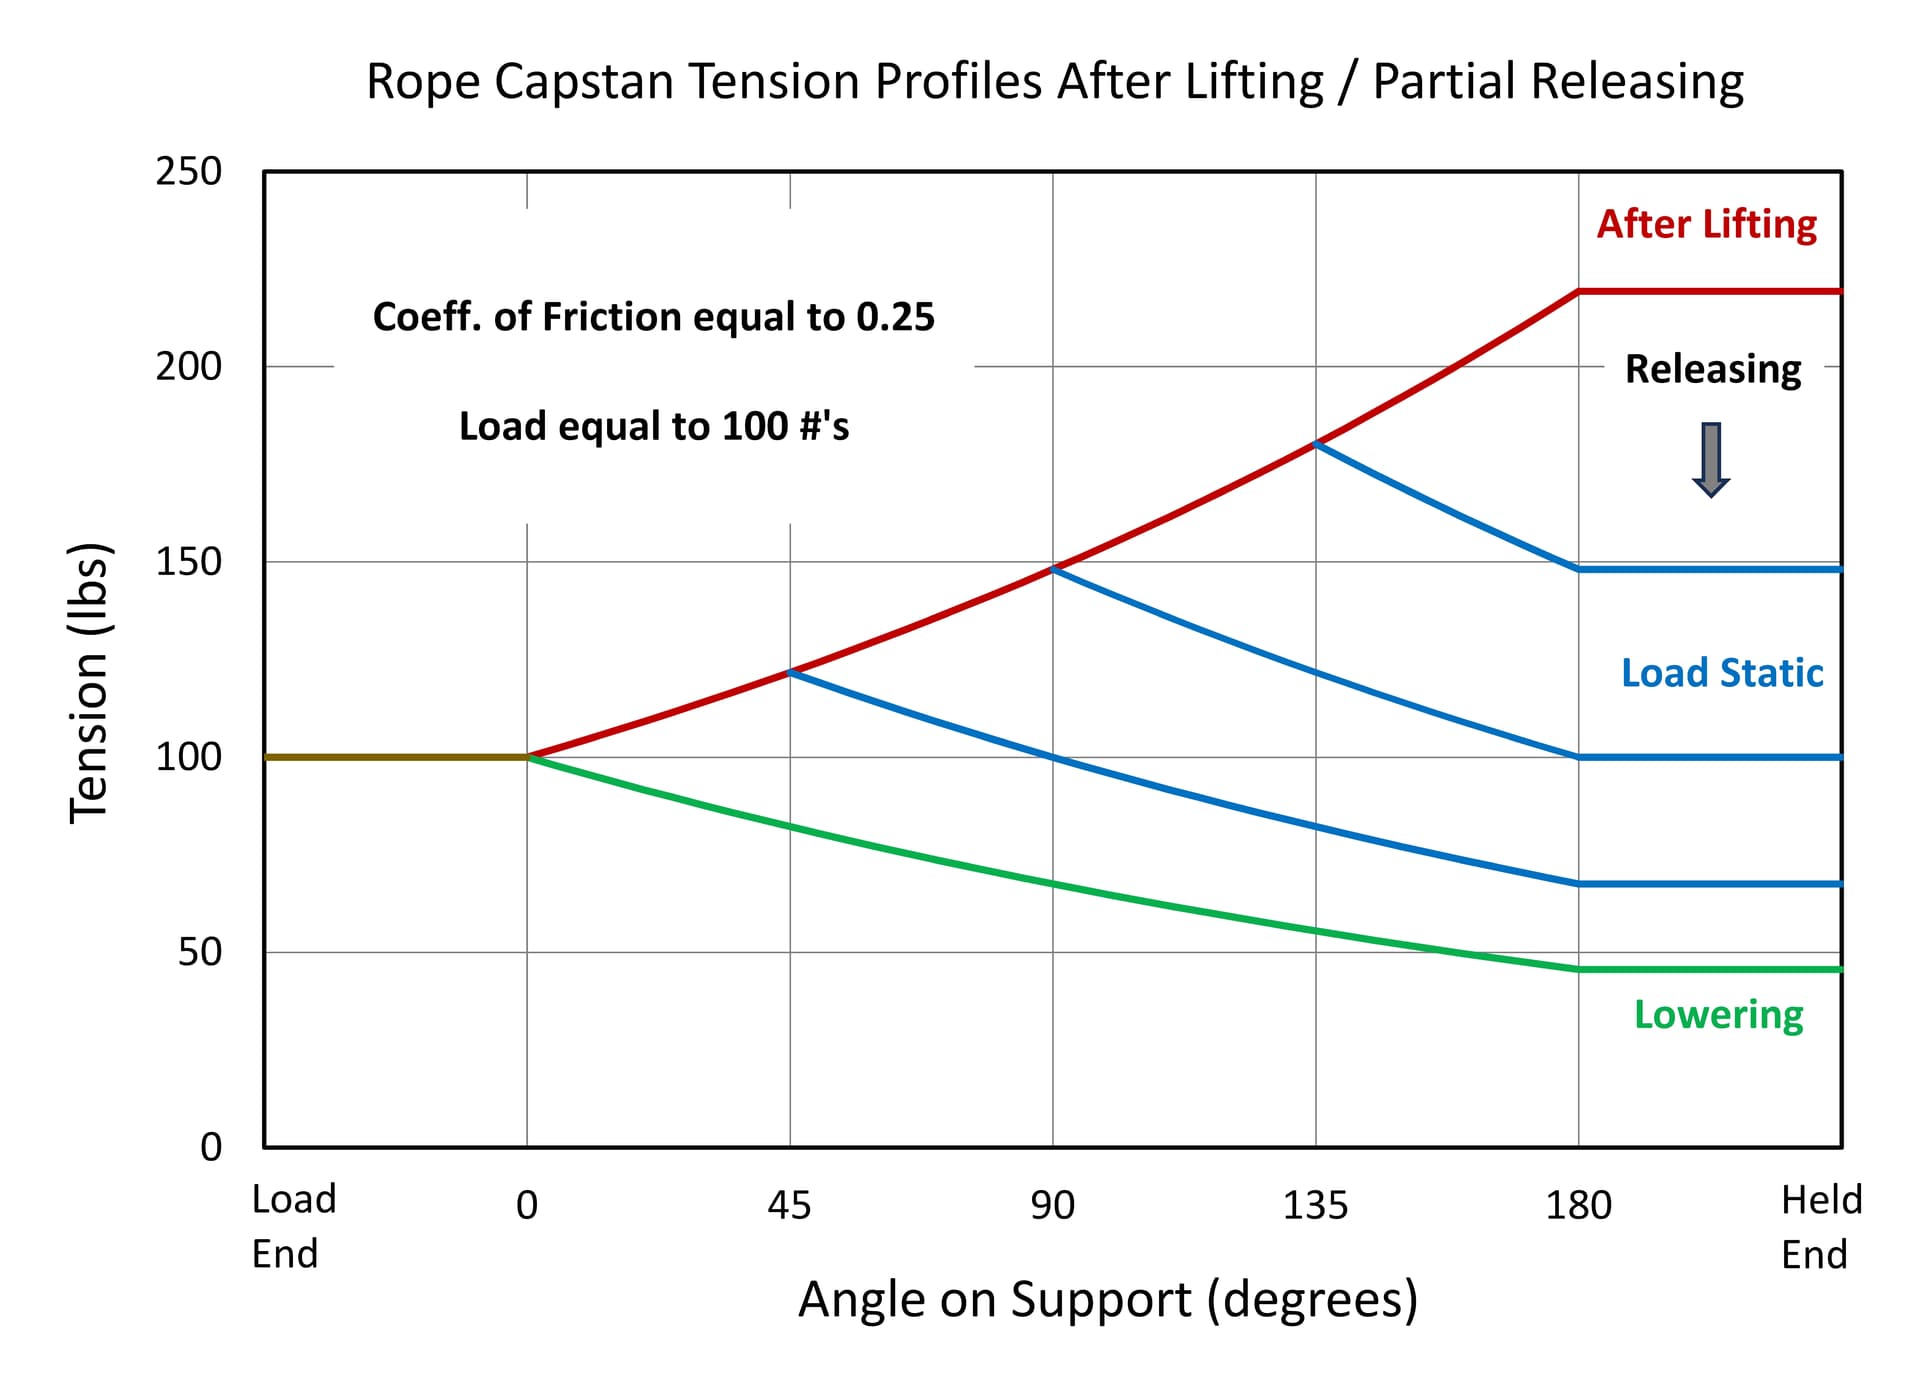
If the force applied to the held end of the rope is further reduced to, let’s say, about 150 pounds, one could speculate that the tension profile will be shown by the topmost blue curve in our graph (along with the brown and part of the upper red steady lifting curve) in accordance with the following model.
Model for easing a suspended load:
- upon reduction of the held force, the rope momentarily retracts as it becomes less stretched
- this retracting rope slides on that part of the support nearest the held end
- the direction of this sliding is toward the load end
- the tension in this sliding rope exponentially increases in the direction of the motion of the rope
- this sliding/increase in tension continues until the tension in the sliding rope equals the tension in the static rope (brown/red curve)
- the rope stops retracting/sliding
One can imagine repeating this reduction of force at the held end all the while the load being suspended and static. Once the force at the held end is reduced to 45.6 pounds, the load will start to be steadily lowered (shown as the brown/green curve). For forces at the easing end less than 45.6 pounds, a force less than 100 pounds will be applied to the load causing its lowering to accelerate.
In the previous graph, note the symmetry in the tension profile for the case of the lifted/suspended load followed by the reduction of the force at the held end to 100 pounds. This tension profile is replicated as the upper curve in the next graph.
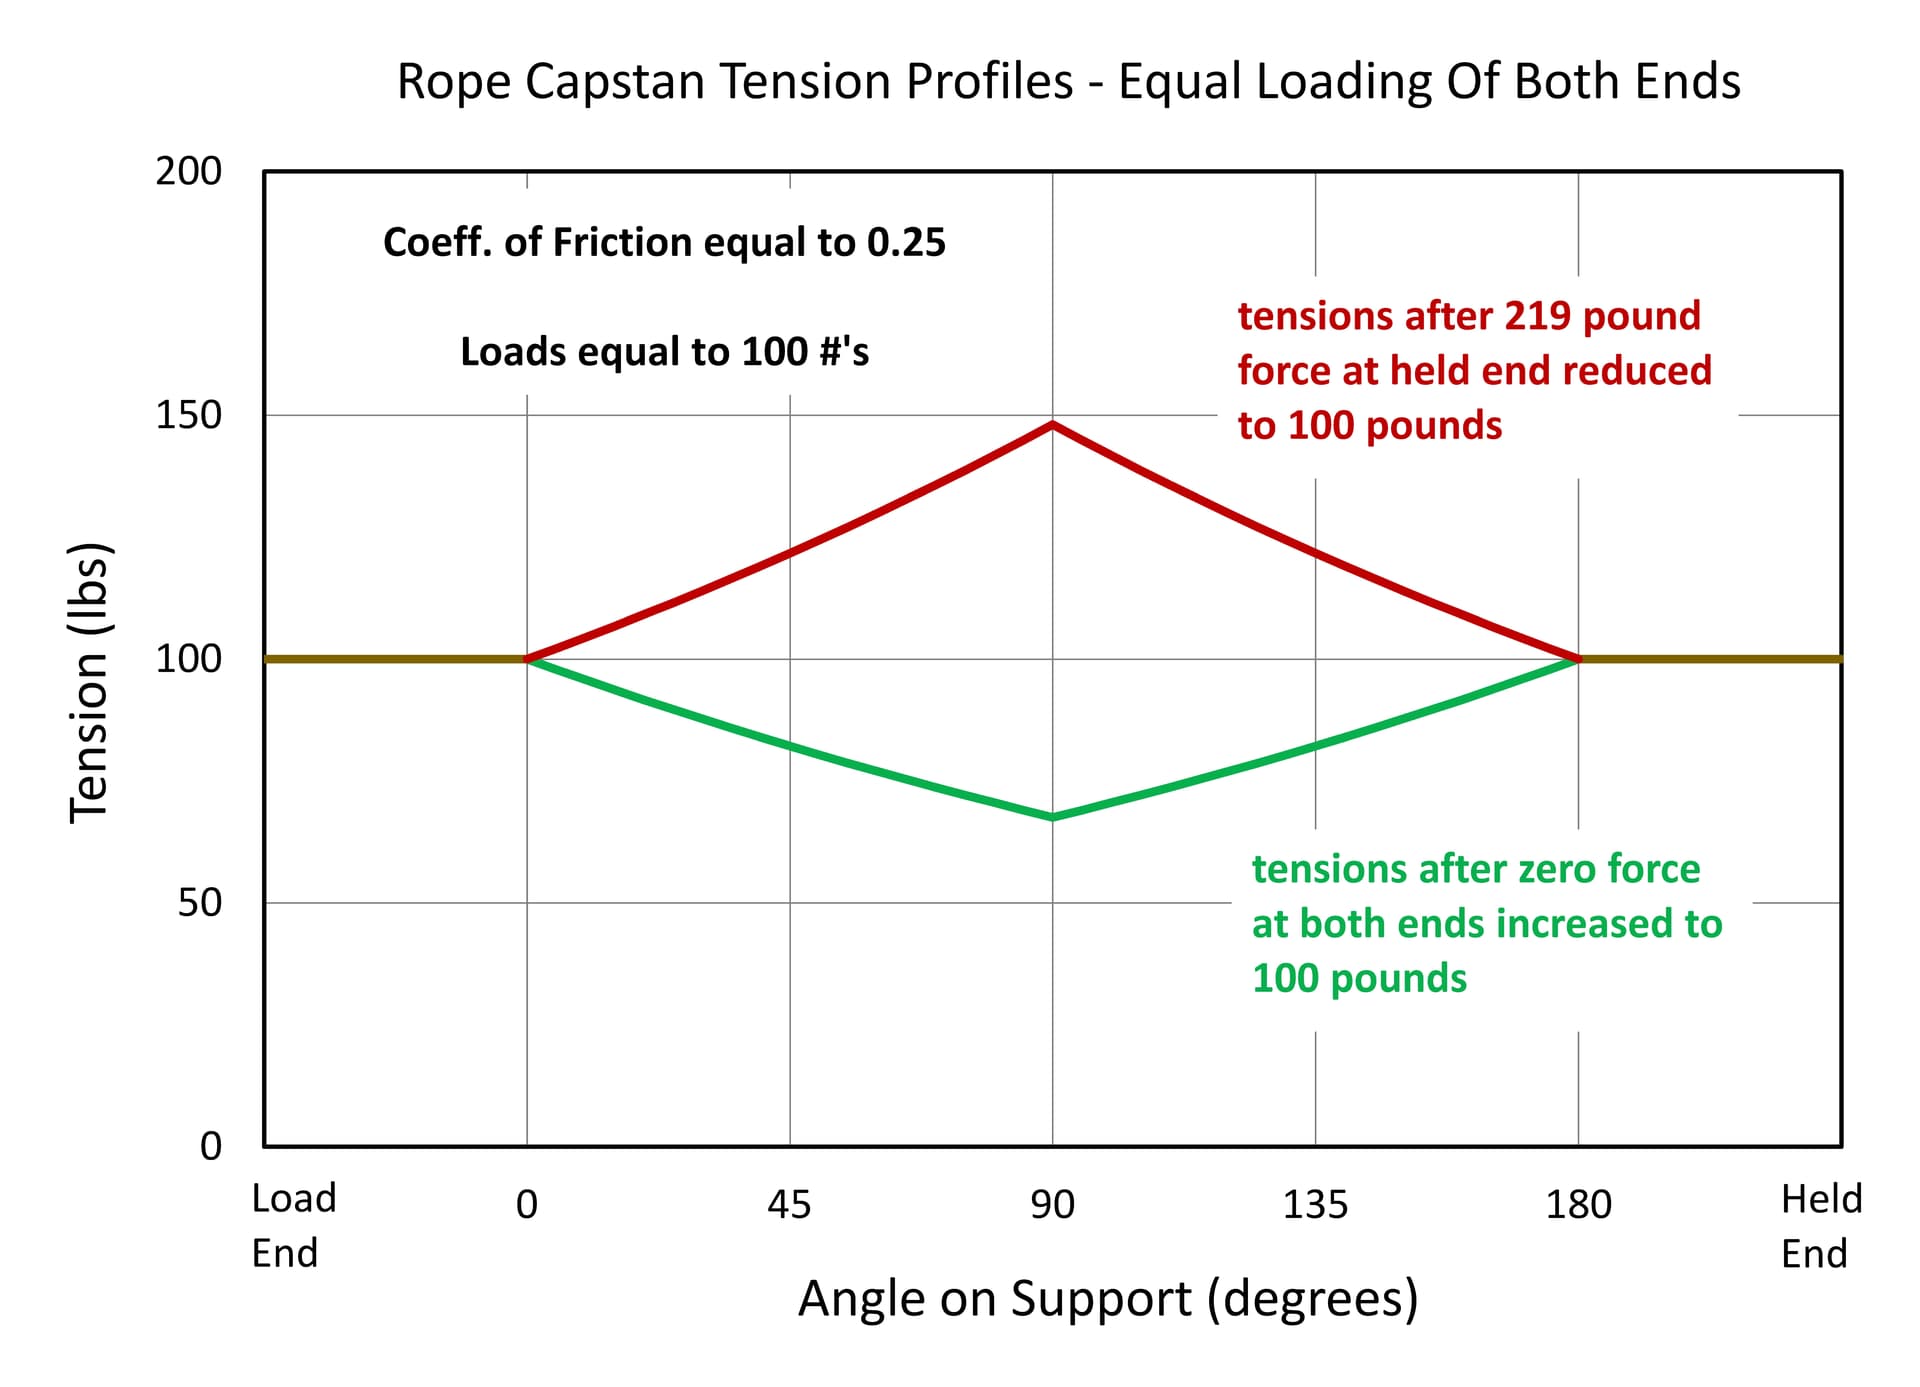
One could ask a different question, what would be the tension profile that is generated by starting with both the “Load” and “Held” ends loosely connected (zero tensions) to 100 pound loads on raised platforms and then symmetrically and slowly lowering the platforms (or equivalently, slowly raising the support) until both 100 pound loads are suspended?
Since the rope travels toward each of the loads from the center of the support (at 90 degrees), the tension symmetrically increases exponentially from the center of the support to the points of rope/support loss of contact (at zero degrees and at 180 degrees) and then is constant to each of the 100 pound loads as seen in the lower curve (brown/green) in the above graph.
Of interest is that the upper curve is the more stable of the two tension profile curves. If one were to transform/increase the tensions for the setup described by the lower curve to the tensions in the upper curve, the 100 pound loads (of the lower curve setup) would drop as the lower curve tensions use more rope. Work would be done by the loads dropping, a sign of instability. In general for a particular geometry and loading, due to stretch in the rope, any tension profile that is either equal or greater in tension than another tension profile over the entire tension profile will require the use of a smaller length of rope and be more stable.